From the team
Button


It is October 2025. The most current metro ranking for single-family permits is year to date through June 2025. That list comes from NAHB’s roll-up of the U.S. Census Building Permits Survey. It is the cleanest early signal of where homes will actually rise. See the underlying program details here and the metro download here. NAHB’s write-up with the June table is here and their ongoing permit portal is here.

Here is where single-family construction is concentrated right now, measured by permits through June 2025.
Houston-Pasadena-The Woodlands, TX: 25,721.
Dallas-Fort Worth-Arlington, TX: 22,599.
Phoenix-Mesa-Chandler, AZ: 13,935.
Atlanta-Sandy Springs-Roswell, GA: 11,833.
Charlotte-Concord-Gastonia, NC-SC: 9,485.
Orlando-Kissimmee-Sanford, FL: 8,600.
Austin-Round Rock-San Marcos, TX: 8,371.
Nashville-Davidson-Murfreesboro-Franklin, TN: 7,256.
Tampa-St. Petersburg-Clearwater, FL: 7,057.
Los Angeles-Long Beach-Anaheim, CA: 6,258.
Source: NAHB analysis of the Census Building Permits Survey, June 2025 YTD (NAHB June 2025).
What this means on the ground
Permits lead starts. Today’s authorization becomes tomorrow’s mobilization. Teams use permits to plan submittals, staffing, procurement, and inspections. For program context see the survey page (Census BPS).
Metro, not city limits. The action sits across each market’s suburbs. Ranking by metro maps to how jurisdictions process work and how builders allocate crews. If you want to dig into the metro spreadsheets, start here (Permits by CBSA).
Sun Belt momentum. Texas and Florida account for four of the top ten, with Orlando posting a year-over-year gain through June. That signals busy plan review pipelines and tight schedules in those metros (NAHB June 2025).
Where Spacial fits
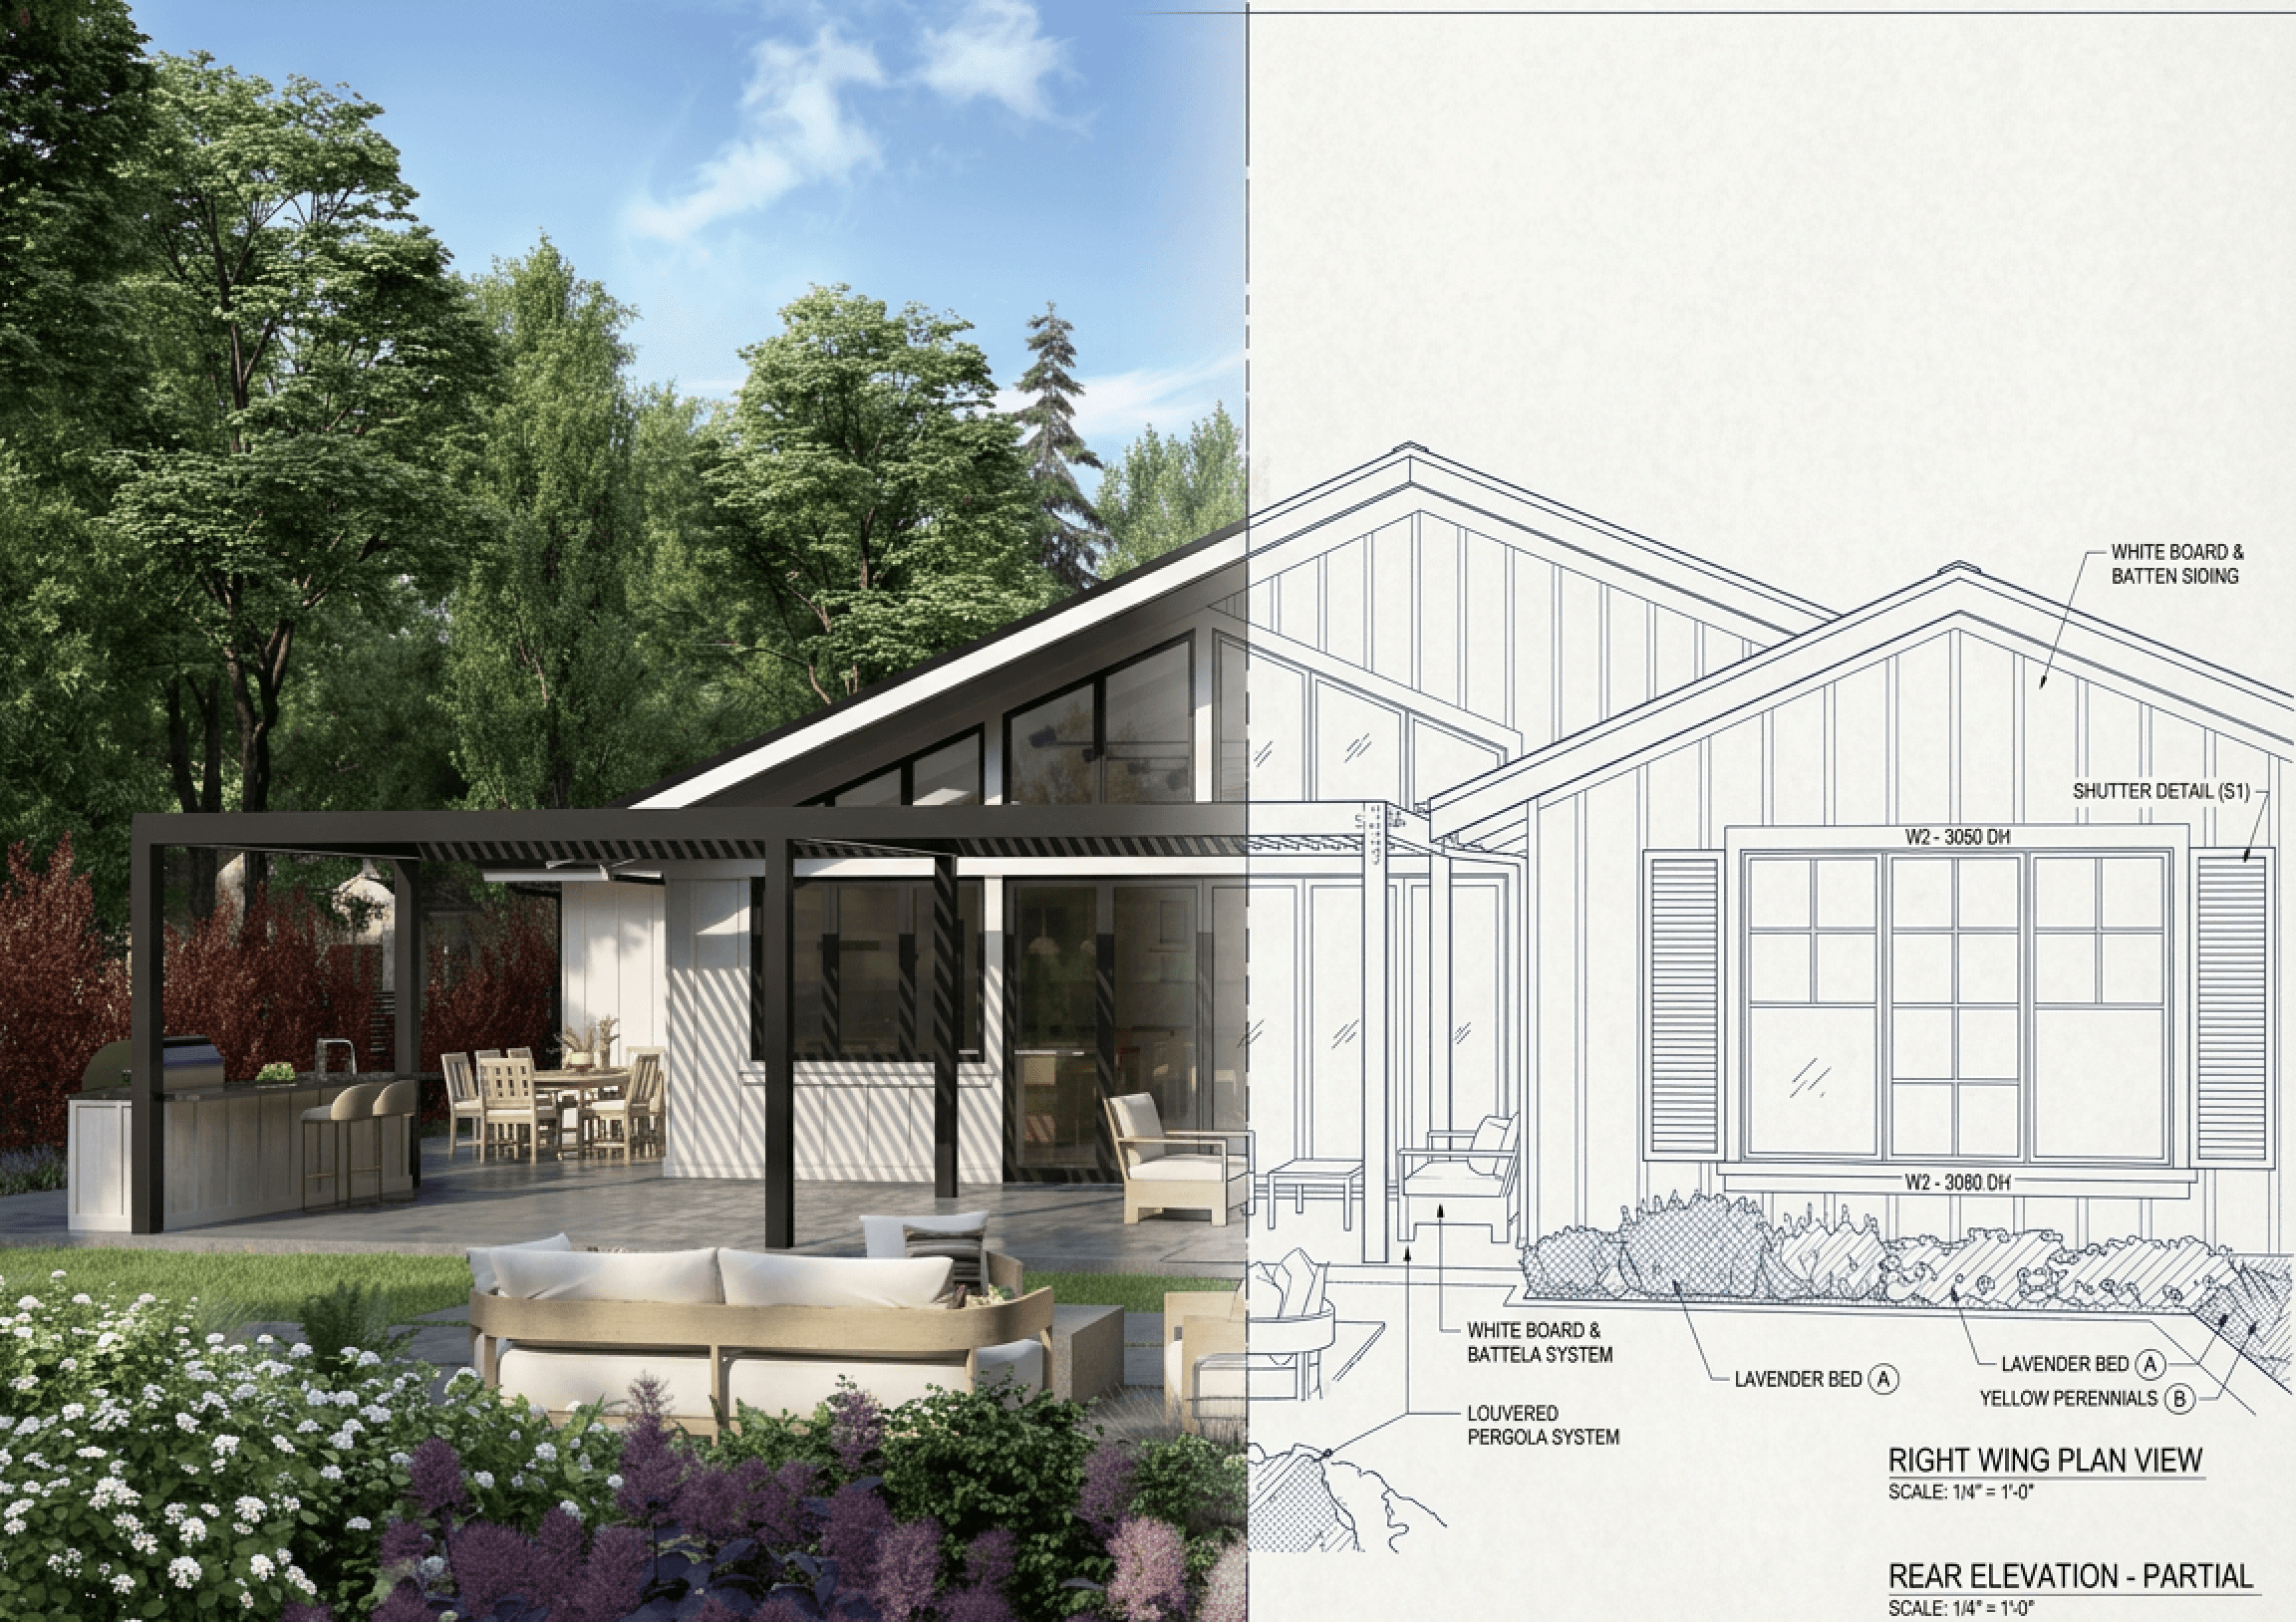
Most delays start on paper. A missed load path. A duct without a route. A detail that conflicts in section. Spacial delivers coordinated structural, MEP, and energy compliance plan sets that are code-checked for the jurisdiction before you submit. Our sets are sealed by licensed engineers where required, packaged for plan review, and built to pass with fewer comments. In high-volume metros like Houston, Dallas, and Phoenix, that time back moves the whole schedule. Want a sample package or a walkthrough of our coordination process? Use the contact form right below this article and tell us about your next submittal.
Method and timing
These figures are non-seasonally adjusted, year to date through June 2025. NAHB compiles the ranking from the U.S. Census Building Permits Survey. We are publishing in October 2025, and this is the most recent official metro table available as of today. When a newer NAHB metro ranking is posted, we update our chart and copy to match the latest release (NAHB Permit Data) (Census BPS).
Want to Learn More?