
The problem
No drawing holds the whole building.
A typical permit set today runs to thousands of lines and symbols across at least five disciplines: architectural, structural, mechanical, electrical, and plumbing. Each one is drawn in a different tool, and there's no common substrate that holds the full building. That's why most coordination errors show up between the drawings, where reviewers are least likely to catch them.

No Shared Model
A single building usually comes with five discipline drawing sets, each in its own file. Every sheet can be accurate on its own and pass review by itself, but there's no substrate underneath that actually models the building. Together they're just a record of what each discipline drew.

Between the drawings
A duct and a beam occupy the same volume; a plumbing stack passes through a shear wall. Inter-discipline clashes appear where trades meet — and existing clash-detection tools already catch many of them.
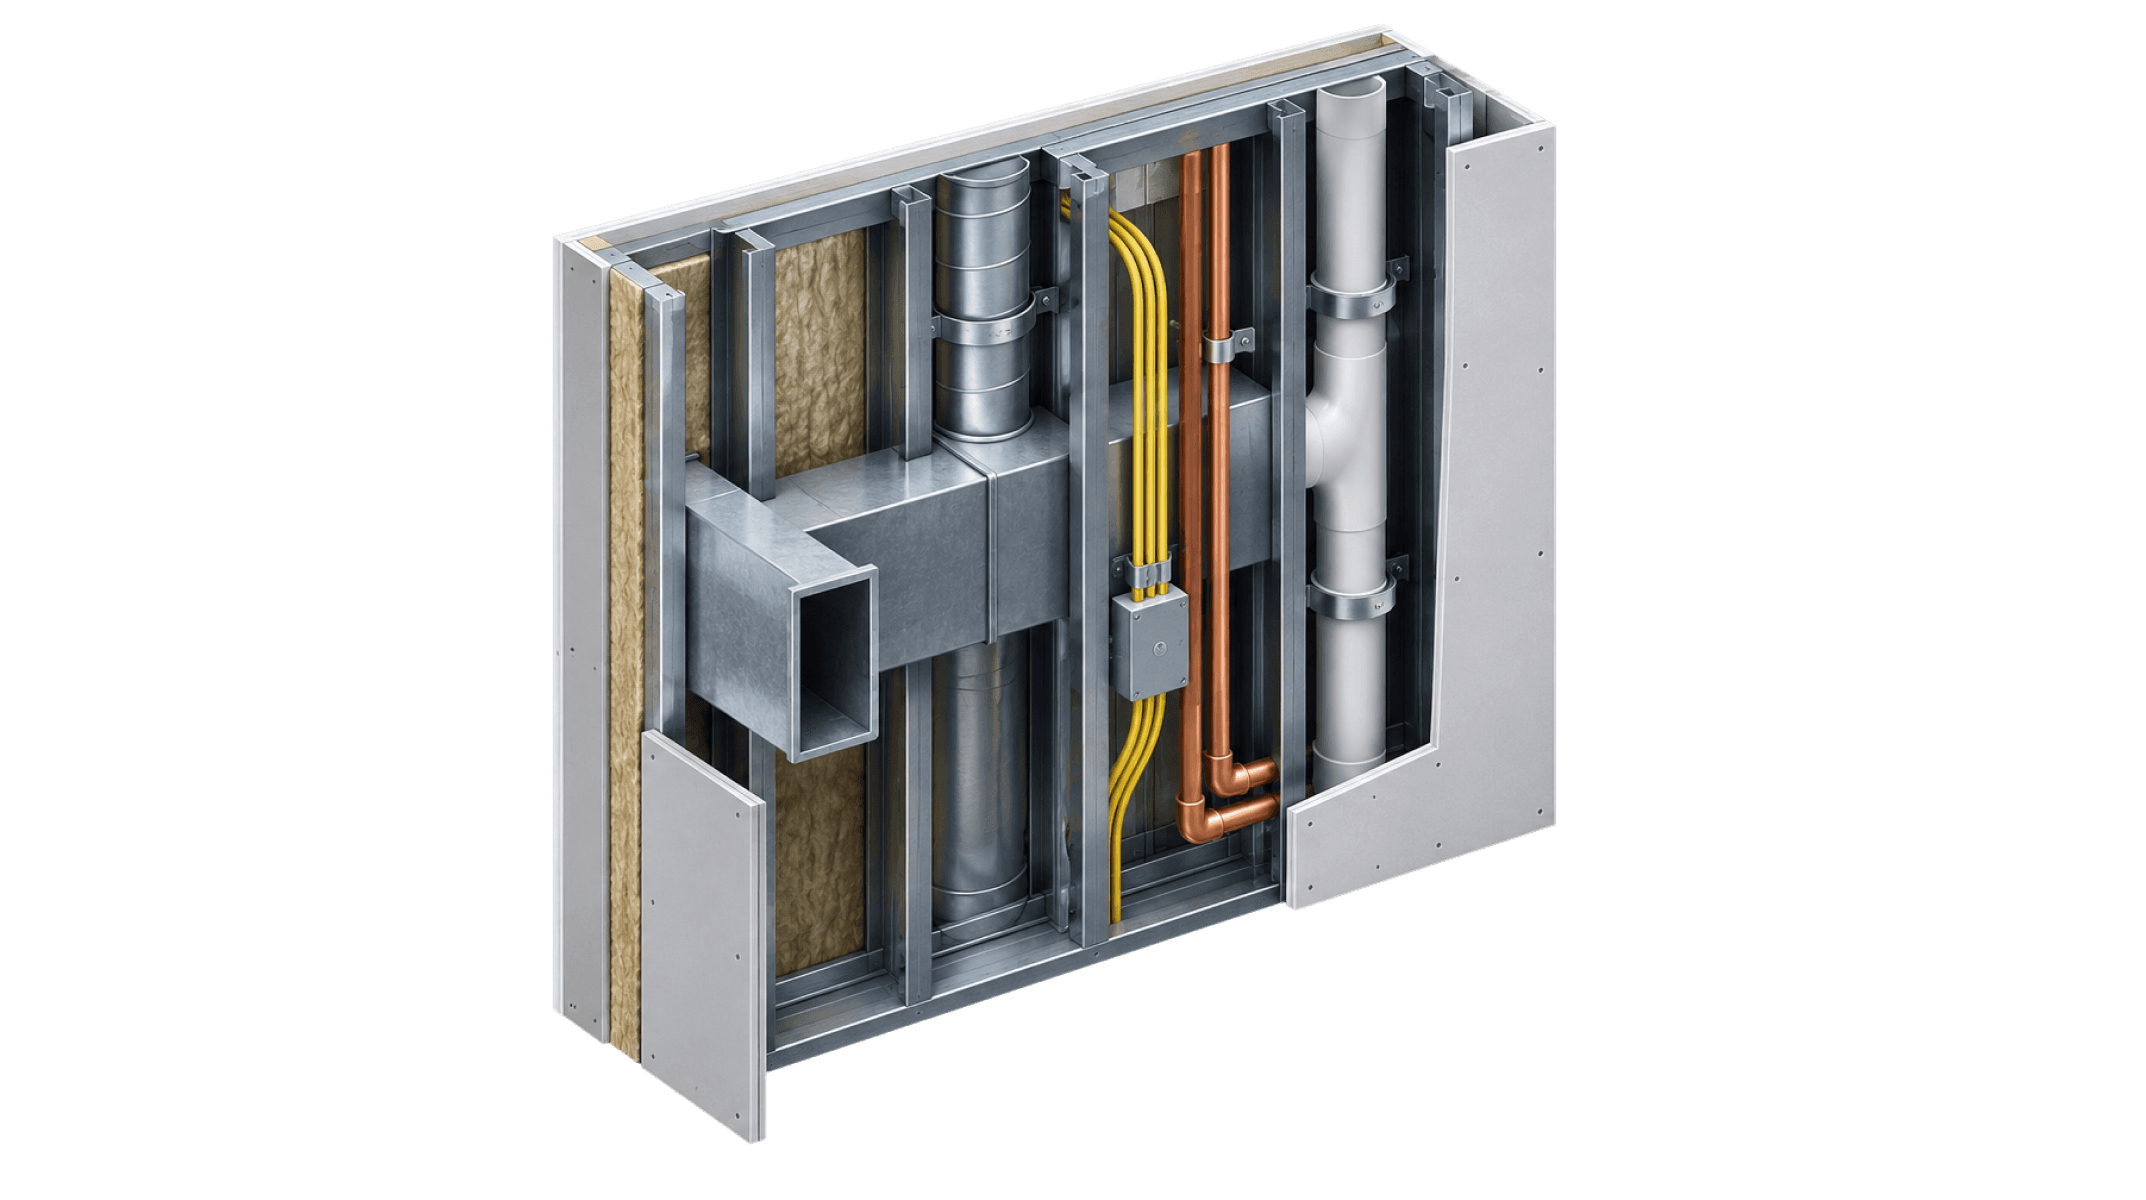
Inside a single element
When insulation, conductors, and a vent stack all need the same wall cavity, the conflict stays invisible. No drawing shows the inside of an element, and no clash tool looks there. Spacial's patent-pending modeling was created to detect these hidden overlaps.
THE CONSTRUCTION WORLD MODEL
One substrate, five layers, every discipline.
Spacial rebuilds every 2D drawing set as an IFC-native object model, the substrate every discipline works from. Each element carries its own identity, the loads acting on it, and the code requirements that apply to it.


The Substrate and Micro-Scale Physics are the two layers this paper focuses on: the first determines what each element can do; the second evaluates what follows when several disciplines act on it at once.
THE UNDERLYING BREAKTHROUGH
Conventional building data models sort everything by type. An element is a wall or a window or a beam, and its behavior comes from that label. Rules written this way can only say yes or no, so they have no way to capture something like a conduit passing through a shear wall, which is allowed but reduces the wall's capacity and only works up to a certain point.
Spacial describes each element by its capabilities rather than its label. Those capabilities are encoded in an attributed bond graph, and every layer built on top of it inherits them.
WORKED EXAMPLE
The conflict no drawing
can show.
A 2×6 exterior wall, three disciplines, one finite cavity.

Shared internal resource.
Wall cavity volume per stud bay
The same 2×6 bay, drawn as it is actually built: R-21 batt insulation, branch-circuit conductors and boxes, and a vent run, all occupying one finite volume no single discipline’s drawing represents.
105%
Total demand exceeds capacity. Spacial flags a 5% over-allocation across thermal, electrical, and plumbing, a conflict that no drawing review would reveal.
VALIDATION EVIDENCE
We test every headline number against classical reference solvers, using a set of real permit plans held out from training. The scoring criteria are locked in before each run.
Every prediction comes with a tested confidence range attached
Conventional tools give you a single number with no sense of how far off it might be. Spacial gives an estimate and a range, both tested on real plans the model never saw during training.
Effective assembly R-value
R-17.5
95% prediction interval: R-16.8 — R-18.2
97.2%
Tolerance-band agreement
Predicted engineering quantities agree with classical reference solutions within registered tolerances.
5×10⁻²s
Per-element evaluation latency
Fast enough to close a design loop inside a working session, not overnight.
0.00%
Hard-constraint violation rate
Structurally-enforced laws are guaranteed by graph topology. They cannot be violated by construction.
ON SCIENTIFIC RIGOR

Within
Registered Tolerance
BASELINE
A predefined reference and acceptance criterion.
MEASURED RESULT
Reported against a criterion registered before the run.
ACCEPTANCE CRITERION
Registered in advance, never fitted after the fact.
THE GRAPH FOUNDATION
One topology, two readings.
One construction graph handles both geometric understanding and physics-aware reasoning, and the underlying building model stays the same throughout.
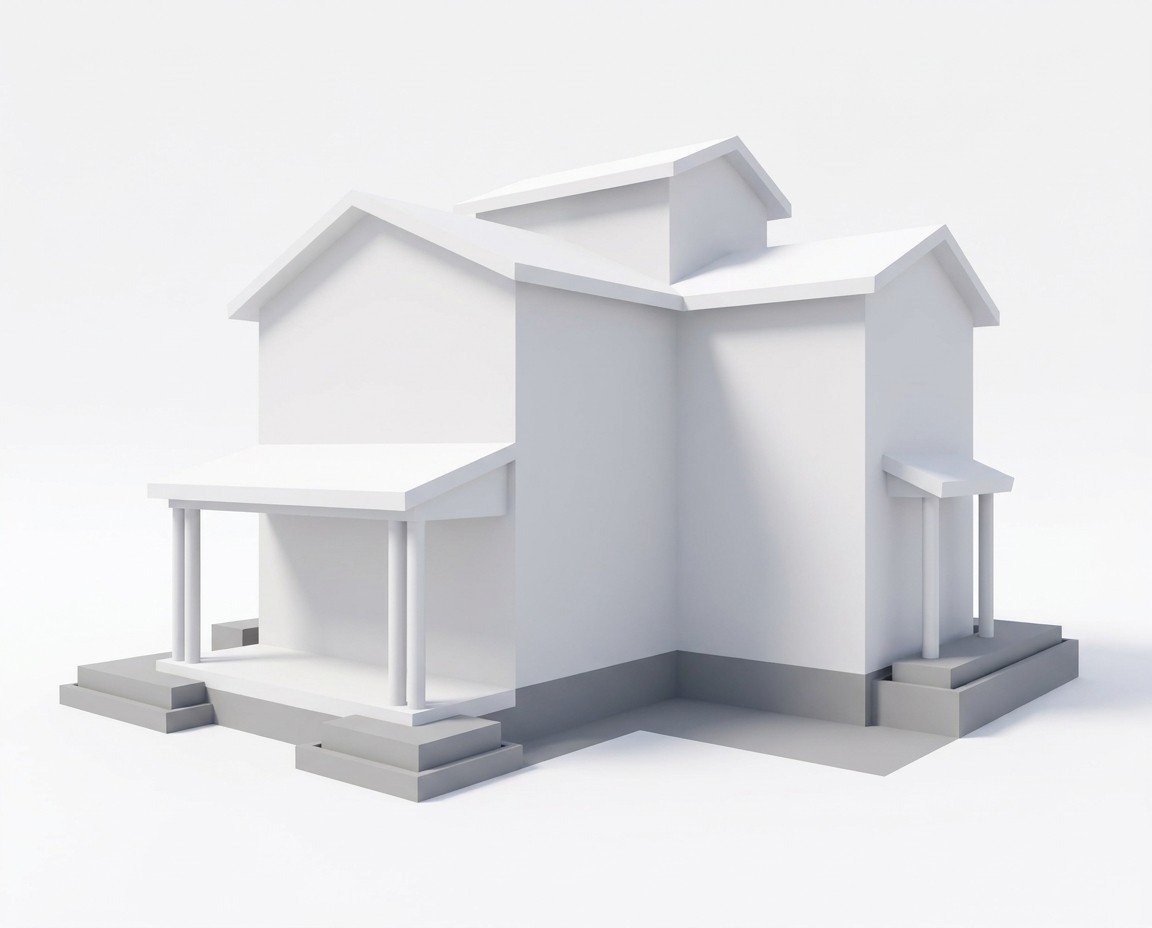
GEOMETRIC READING · Other models
Shape, position, adjacency, and the relationships a conventional graph can observe.
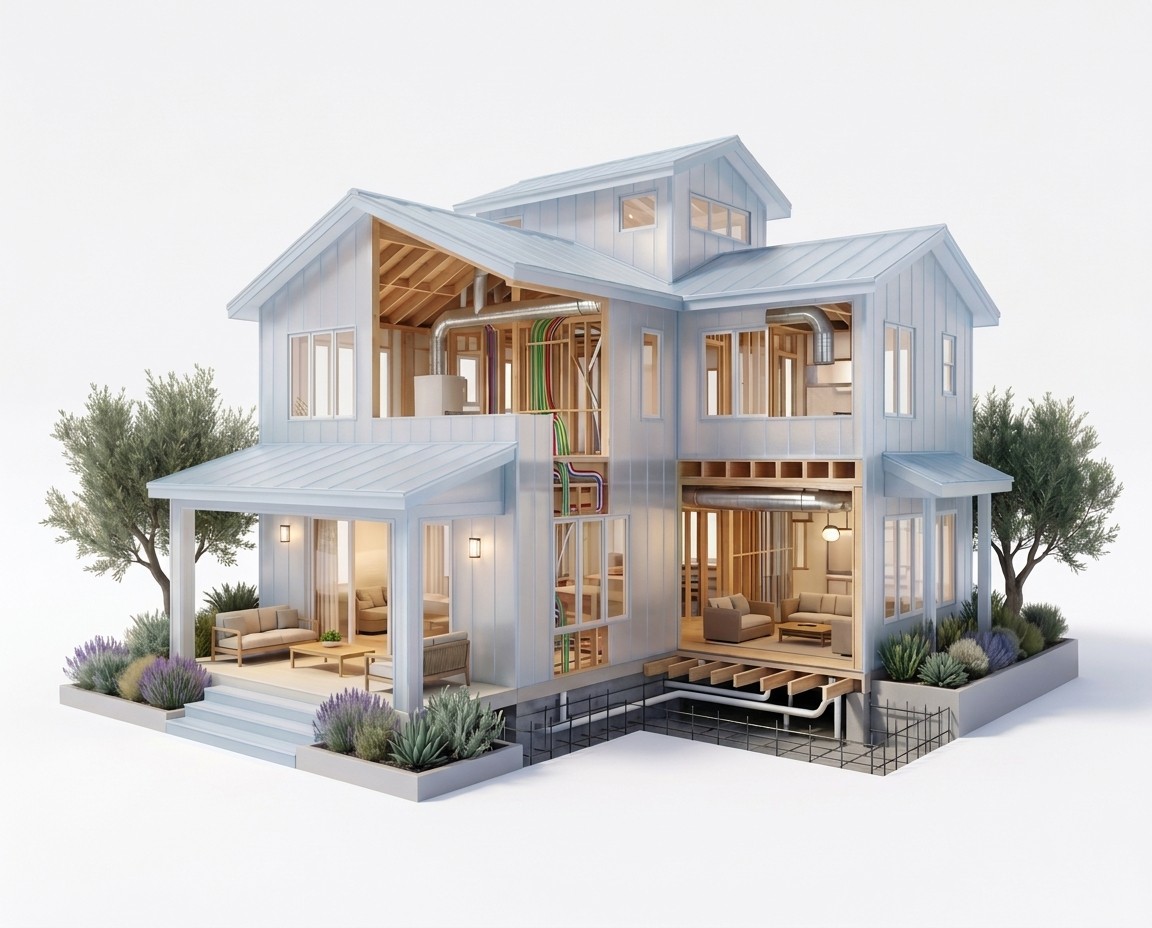
PHYSICS-GROUNDED READING · SPACIAL MODEL
Loads, flow participation, and conservation residuals computed from the same connected model.
SEMANTIC & GEOMETRIC VIEW
Object & role identification — assigns useful roles to walls, beams, systems, and openings.
Connectivity & compliance — infers missing links and checks paths against building rules.
Geometric clash detection — flags conflicts before they become field conditions.
PHYSICS-GROUNDED VIEW
Thermal & energy modeling — reads nodes as capacities, boundaries, and flows.
Unintended leak prediction — surfaces hidden links across structural, thermal, and MEP zones.
Conservation-law monitoring — detects when energy, air, or mass balance breaks.
01 · INPUT
Attributed graph
02 · ENCODER
Message passing
03 · EMBEDDINGS
Vector per node
04 · TASK HEAD
Readout → output
VALIDATION PROTOCOL
A four-tier reference framework, not a single benchmark.
Spacial checks each prediction against reference evidence that gets harder to match at every step, starting with analytic answers, then independent solvers, then measured buildings, and finally real field records.

TIER 1
Analytical solutions
Closed-form references confirm that the model reproduces the governing equations correctly and reveal any numerical instability.

TIER 2
Independent solvers
We compare results against established engineering software that had no role in producing the model's training data.
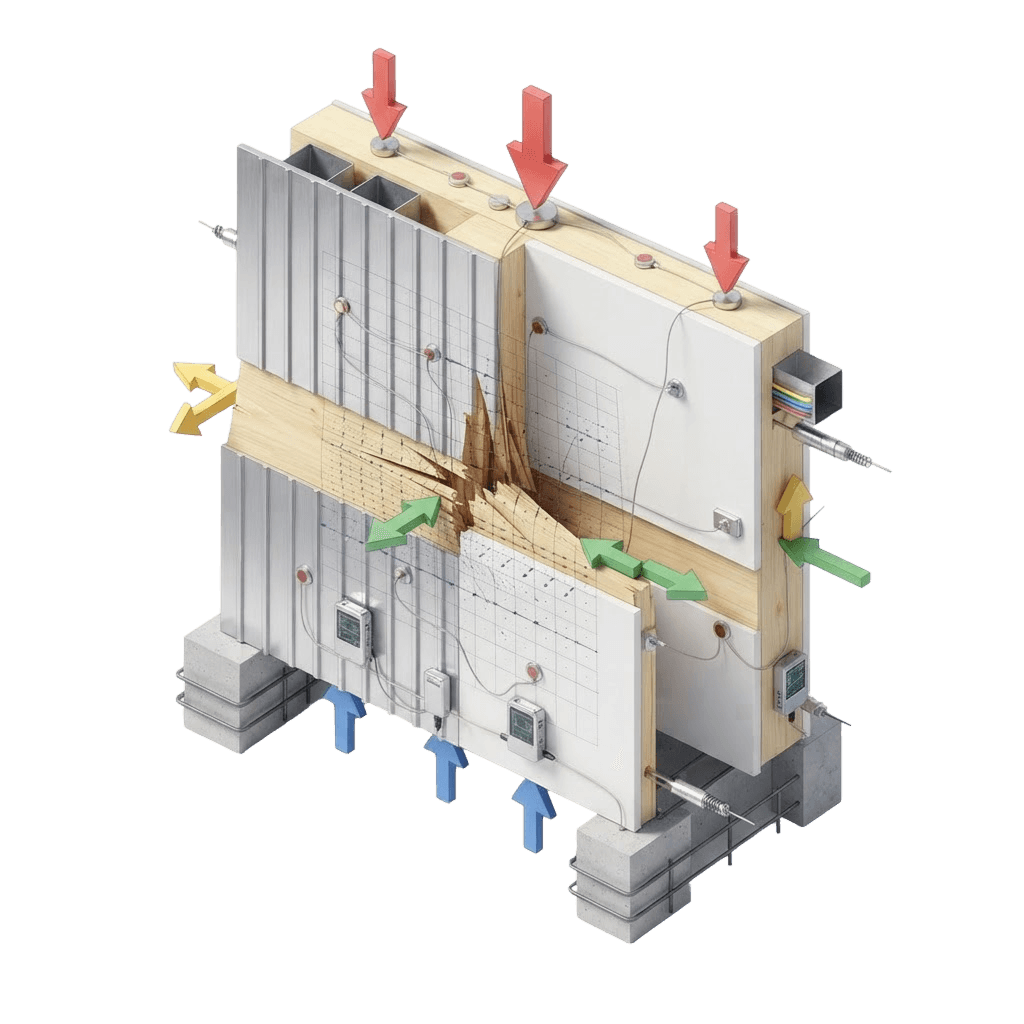
TIER 3
Measured field data
We compare predictions with data from instrumented buildings, where what the building actually does counts for more than agreement with a simulation.

TIER 4
Field defect records
Plan-review comments, RFIs, and change orders reveal which errors would have been caught before construction.

No leakage between train and test
Evaluation splits at the project level, grouping near-duplicate plans and preserving the geographic, jurisdictional, and author separation a real deployment requires.

Criteria are registered before the run
Tolerance bands are locked before testing, and any result that misses its criterion is reported as a failure.
The tail is reported, not just the mean
Averages do not describe every prediction. Maximum and high-percentile error are reported alongside central estimates so safety-relevant outliers are visible and can be escalated for engineering review.